Microsoft 365 Defender – part 3
In our previous posts, we have looked at some of the basics of Microsoft 365 Defender. For those of you who want to learn more, Microsoft has done something pretty amazing for us. They have included a learning hub. Here you can look at different learning paths, look at info for the different products and also go into specific topics.
(Part 1 and part 2 in this series can be found by clicking on the links.)
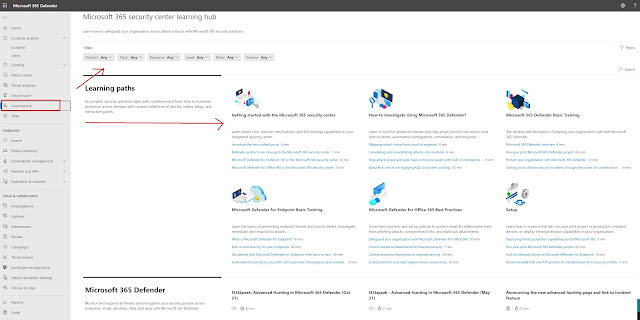 |
| Free training! (Yay) |
By selecting the Products option, you are able to look at specific products that you want more info about:
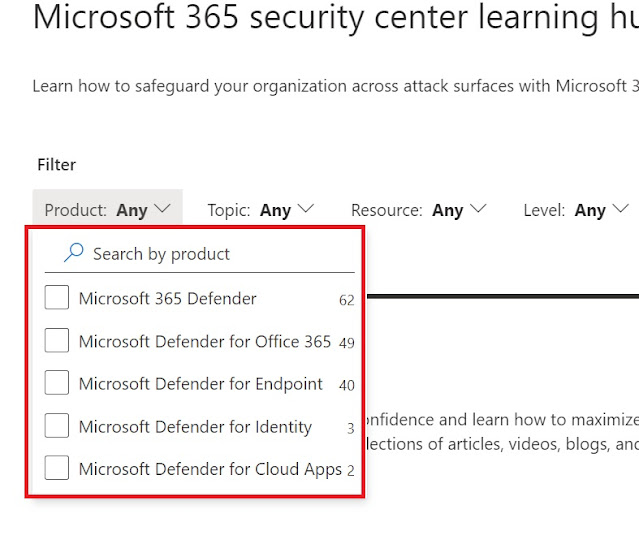 |
| The different Defender products in Microsoft 365 Defender. |
If you want to search for a topic, you have quite a few to choose from:
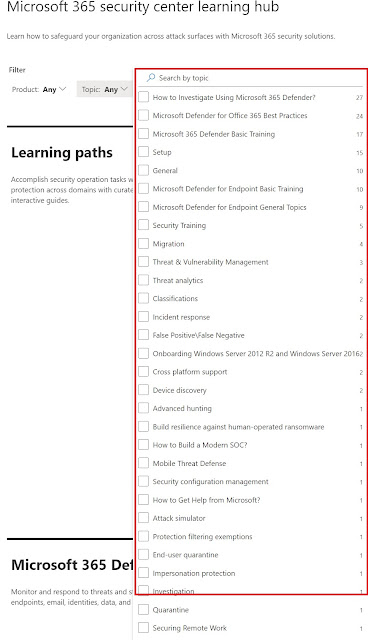 |
| Topics |
But for today we will be looking at another interesting feature in Microsoft 365 Defender, and this is located under Endpoints in the left menu. As you can probably tell, Endpoints is where we find some of the info related to our clients. There are other places as well, but we will get into that later. Here we will have a list over our endpoints, network devices and IoT devices. Not only that, but each device will have a risk level, exposure level, OS version, and onboarded status listed. We can choose to sort these by the different categories to gain insight into what we should look at, and what seems to be safe. As you can see in the picture below, we have a device with high risk level, medium exposure level and it is onboarded. By onboarded we mean that it is onboarded to Defender for Endpoint.
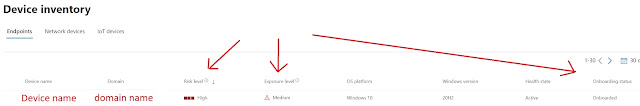 |
| A machine with trouble? |
Risk is one of the features that does not come in until you get a AAD P2/M365 E5 type of license. It is calculated based on different type of collected info, like leaked credentials, suspicious or anomalous behavior and more. We may get into risk and how it is calculated in a later blog post. As you can tell, the high risk in the above example is not great. That means we should definitely look into what's going on. A medium exposure level is also something we should look into. By clicking on the line, we get a details pane for this machine.
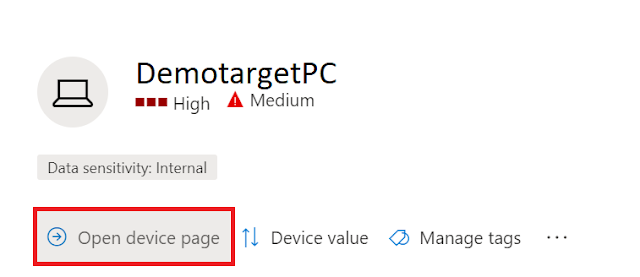 |
| See more details |
From here we can open the device page which wil. Give us a lot of insight into the device.
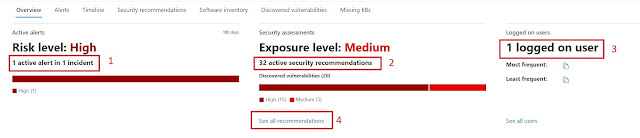 |
| More details |
- We can see that the risk is High because of 1 active alert in 1 incident. In this case it was because the user had clicked on a suspicious URL. The URL was safe, and the alert was false in our example.
- There are 32 active security recommendations, which in this case is related to outdated software.
- We can see who uses the computer.
Using the Device inventory gives us a great overview over things that are happening in our organization. I often use this panel to look through things and try to investigate alerts and check them out as I find them.
Endpoints
The last thing we will take a quick look at today is another place to look at Endpoint settings. And this is found under settings in the left menu:
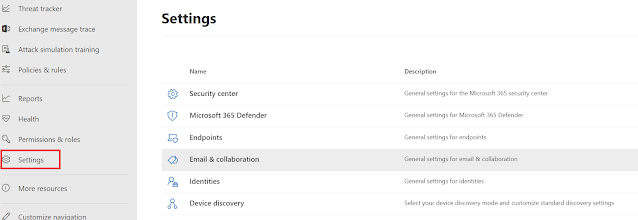 |
| More things to look at |
If you go to Endpoints here, you will see many useful settings that you may want to configure. Things like email notifications for alerts. (If you want to be alerted when new alerts pop up, or new vulnerabilities are found etc.). You can define custom roles for certain tasks in defender, organize devices into groups, set automated remediation levels, and assign administrators under Device groups and configure your SIEM (Sentinel for instance) system and more.
And with that we will stop for today. The next blog posts will look further into Defender, and stuff like attack simulation training for your users, the threat and vulnerability dashboard, Defender for Office 365 and more.


Comments
Post a Comment